Shell 实战项目
1. 前言
通过之前的学习,我们已经分章节系统性的讲解了 Shell 脚本的知识,本章节我们通过两个项目实战,进一步详解 Shell 在实战中的知识组合及灵活运用。
2. 系统巡检
2.1 需求
需要对 Linux 服务器,巡检系统 / 服务 / 端口各指标及参数,编写系统快速检查脚本,输出系统信息到脚本运行的 logs 目录下。
2.2 思路
通常系统的状态都在 /proc/ 目录下,对文件中的关注系统指标数字进行过滤处理,得到系统状态,其中涉及数组的需要计算,可以利用函数,对每一个需要巡检的结果利用单独一个函数编写,最后利用 main 函数调用其他函数得出最终结果。
2.3 实现
核心利用 sed 代码:
#!/bin/bash
# auth:kaliarch
# func:sys info check
# version:v1.0
# sys:centos6.x/7.x

# 判断用户是否为root用户,如果非root则提示需要root用户执行脚本
[ $(id -u) -gt 0 ] && echo "请用root用户执行此脚本!" && exit 1
sysversion=$(rpm -q centos-release|cut -d- -f3)
line="-------------------------------------------------"

# 创建日志目录
[ -d logs ] || mkdir logs

# 定义日志文件
sys_check_file="logs/$(ip a show dev eth0|grep -w inet|awk '{print $2}'|awk -F '/' '{print $1}')-`date +%Y%m%d`.txt"

# 获取系统cpu信息
function get_cpu_info() {
    Physical_CPUs=$(grep "physical id" /proc/cpuinfo| sort | uniq | wc -l)
    Virt_CPUs=$(grep "processor" /proc/cpuinfo | wc -l)
    CPU_Kernels=$(grep "cores" /proc/cpuinfo|uniq| awk -F ': ' '{print $2}')
    CPU_Type=$(grep "model name" /proc/cpuinfo | awk -F ': ' '{print $2}' | sort | uniq)
    CPU_Arch=$(uname -m)
cat <<EOF | column -t
CPU信息:

物理CPU个数: $Physical_CPUs
逻辑CPU个数: $Virt_CPUs
每CPU核心数: $CPU_Kernels
CPU型号: $CPU_Type
CPU架构: $CPU_Arch
EOF
}

# 获取系统内存信息
function get_mem_info() {
    check_mem=$(free -m)
    MemTotal=$(grep MemTotal /proc/meminfo| awk '{print $2}')  #KB
    MemFree=$(grep MemFree /proc/meminfo| awk '{print $2}')    #KB
    let MemUsed=MemTotal-MemFree
    MemPercent=$(awk "BEGIN {if($MemTotal==0){printf 100}else{printf \"%.2f\",$MemUsed\*100/$MemTotal}}")
    report_MemTotal="$((MemTotal/1024))""MB"        #内存总容量(MB)
    report_MemFree="$((MemFree/1024))""MB"          #内存剩余(MB)
    report_MemUsedPercent="$(awk "BEGIN {if($MemTotal==0){printf 100}else{printf \"%.2f\",$MemUsed\*100/$MemTotal}}")""%"   #内存使用率%

cat <<EOF
内存信息:

${check_mem}
EOF
}

# 获取系统网络信息
function get_net_info() {
    pri_ipadd=$(ip a show dev eth0|grep -w inet|awk '{print $2}'|awk -F '/' '{print $1}')
    pub_ipadd=$(curl ifconfig.me -s)
    gateway=$(ip route | grep default | awk '{print $3}')
    mac_info=$(ip link| egrep -v "lo"|grep link|awk '{print $2}')
    dns_config=$(egrep -v "^$|^#" /etc/resolv.conf)
    route_info=$(route -n)
cat <<EOF | column -t
IP信息:

系统公网地址: ${pub_ipadd}
系统私网地址: ${pri_ipadd}
网关地址: ${gateway}
MAC地址: ${mac_info}

路由信息:
${route_info}

DNS 信息:
${dns_config}
EOF
}

# 获取系统磁盘信息
function get_disk_info() {
    disk_info=$(fdisk -l|grep "Disk /dev"|cut -d, -f1)
    disk_use=$(df -hTP|awk '$2!="tmpfs"{print}')
    disk_inode=$(df -hiP|awk '$1!="tmpfs"{print}')

cat <<EOF
磁盘信息:

${disk_info}
磁盘使用:

${disk_use}
inode信息:

${disk_inode}
EOF


}

# 获取系统信息
function get_systatus_info() {
    sys_os=$(uname -o)
    sys_release=$(cat /etc/redhat-release)
    sys_kernel=$(uname -r)
    sys_hostname=$(hostname)
    sys_selinux=$(getenforce)
    sys_lang=$(echo $LANG)
    sys_lastreboot=$(who -b | awk '{print $3,$4}')
    sys_runtime=$(uptime |awk '{print $3,$4}'|cut -d, -f1)
    sys_time=$(date)
    sys_load=$(uptime |cut -d: -f5)

cat <<EOF | column -t
系统信息:

系统: ${sys_os}
发行版本:   ${sys_release}
系统内核:   ${sys_kernel}
主机名:    ${sys_hostname}
selinux状态:  ${sys_selinux}
系统语言:   ${sys_lang}
系统当前时间: ${sys_time}
系统最后重启时间:   ${sys_lastreboot}
系统运行时间: ${sys_runtime}
系统负载:   ${sys_load}
EOF
}

# 获取服务信息
function get_service_info() {
    port_listen=$(netstat -lntup|grep -v "Active Internet")
    kernel_config=$(sysctl -p 2>/dev/null)
    if [ ${sysversion} -gt 6 ];then
        service_config=$(systemctl list-unit-files --type=service --state=enabled|grep "enabled")
        run_service=$(systemctl list-units --type=service --state=running |grep ".service")
    else
        service_config=$(/sbin/chkconfig | grep -E ":on|:启用" |column -t)
        run_service=$(/sbin/service --status-all|grep -E "running")
    fi
cat <<EOF
服务启动配置:

${service_config}
${line}
运行的服务:

${run_service}
${line}
监听端口:

${port_listen}
${line}
内核参考配置:

${kernel_config}

}

# 获取系统用户信息
function get_sys_user() {
    login_user=$(awk -F: '{if ($NF=="/bin/bash") print $0}' /etc/passwd)
    ssh_config=$(egrep -v "^#|^$" /etc/ssh/sshd_config)
    sudo_config=$(egrep -v "^#|^$" /etc/sudoers |grep -v "^Defaults")
    host_config=$(egrep -v "^#|^$" /etc/hosts)
    crond_config=$(for cronuser in /var/spool/cron/\* ;do ls ${cronuser} 2>/dev/null|cut -d/ -f5;egrep -v "^$|^#" ${cronuser} 2>/dev/null;echo "";done)
cat <<EOF
系统登录用户:

${login_user}
${line}
ssh 配置信息:

${ssh_config}
${line}
sudo 配置用户:

${sudo_config}
${line}
定时任务配置:

${crond_config}
${line}
hosts 信息:

${host_config}
EOF
}

# 获取进程信息
function process_top_info() {

    top_title=$(top -b n1|head -7|tail -1)
    cpu_top10=$(top b -n1 | head -17 | tail -10)
    mem_top10=$(top -b n1|head -17|tail -10|sort -k10 -r)

cat <<EOF
CPU占用top10:

${top_title}
${cpu_top10}

内存占用top10:

${top_title}
${mem_top10}
EOF
}

# 信息汇总
function sys_check() {
    get_cpu_info
    echo ${line}
    get_mem_info
    echo ${line}
    get_net_info
    echo ${line}
    get_disk_info
    echo ${line}
    get_systatus_info
    echo ${line}
    get_service_info
    echo ${line}
    get_sys_user
    echo ${line}
    process_top_info
}


sys_check > ${sys_check_file}
2.4 测试
[root@master workspace]# bash sys\_check.sh
[root@master workspace]# ls
logs  sys_check.sh
[root@master workspace]# cat logs/172.16.60.2-20200419.txt
CPU信息:
物理CPU个数:  4
逻辑CPU个数:  4
每CPU核心数:  1
CPU型号:      QEMU    Virtual  CPU
CPU架构:      x86_64
-------------------------------------------------
内存信息:

              total        used        free      shared  buff/cache   available
Mem:          16047       12536         179         885        3331        2007
Swap:             0           0           0
-------------------------------------------------
IP信息:
系统公网地址:      4x.xxx.xxx.18
系统私网地址:      172.16.60.2
网关地址:          172.16.60.1
MAC地址:           52:54:73:7b:c9:11
路由信息:
Kernel             IP                 routing          table
Destination        Gateway            Genmask          Flags  Metric  Ref  Use  Iface
0.0.0.0            172.16.60.1        0.0.0.0          UG     100     0    0    eth0
10.233.88.192      172.16.60.5        255.255.255.192  UG     0       0    0    tunl0
172.16.60.0        0.0.0.0            255.255.255.0    U      100     0    0    eth0
172.17.0.0         0.0.0.0            255.255.0.0      U      0       0    0    docker0
DNS                信息:
nameserver         10.17.50.3
nameserver         1.2.4.8
-------------------------------------------------
磁盘信息:

Disk /dev/vda: 21.5 GB
Disk /dev/vdb: 8589 MB
磁盘使用:

Filesystem     Type      Size  Used Avail Use% Mounted on
/dev/vda1      ext4       20G  5.0G   14G  27% /
devtmpfs       devtmpfs  7.9G     0  7.9G   0% /dev
/dev/vdc       ext4      197G   46G  142G  25% /data
/dev/vdd       xfs       500G   53G  448G  11% /var/local/osd0

inode信息:

Filesystem     Inodes IUsed IFree IUse% Mounted on
/dev/vda1        1.3M   54K  1.2M    5% /
devtmpfs         2.0M   398  2.0M    1% /dev
/dev/vdc          13M  1.3M   12M   11% /data
/dev/vdd         250M   14K  250M    1% /var/local/osd0
overlay           13M  1.3M   12M   11% 2c99089efbac12ffc5d7a8f6ccf99d95ab3c1674b441205a61829ebe635/merged

系统:              GNU/Linux
发行版本:          CentOS                 Linux  release  7.4.1708  (Core)
系统内核:          3.10.0-693.el7.x86_64
主机名:            master
selinux状态:       Permissive
系统语言:          en_US.UTF-8
系统当前时间:      Sun                    Apr    19       12:34:35  CST     2020
系统最后重启时间:  2020-03-18             16:15
系统运行时间:      31                     days
系统负载:          1.55,                  1.73,  1.95
-------------------------------------------------
服务启动配置:

auditd.service                              enabled
autovt@.service                             enabled
ceph-mon@.service                           enabled
etcd.service                                enabled
gapd.service                                enabled
getty@.service                              enabled
irqbalance.service                          enabled
kdump.service                               enabled
kubelet.service                             enabled
microcode.service                           enabled
NetworkManager-dispatcher.service           enabled
NetworkManager.service                      enabled
postfix.service                             enabled
rpcbind.service                             enabled
rsyslog.service                             enabled
smarteye-server-agent.service               enabled
sshd.service                                enabled
systemd-readahead-collect.service           enabled
systemd-readahead-drop.service              enabled
systemd-readahead-replay.service            enabled
tuned.service                               enabled
-------------------------------------------------
运行的服务:

auditd.service                loaded active running Security Auditing Service
ceph-mon@master.service       loaded active running Ceph cluster monitor daemon
ceph-osd@0.service            loaded active running Ceph object storage daemon
chronyd.service               loaded active running NTP client/server
crond.service                 loaded active running Command Scheduler
dbus.service                  loaded active running D-Bus System Message Bus
docker.service                loaded active running Docker Application Container Engine
etcd.service                  loaded active running etcd docker wrapper
gapd.service                  loaded active running guest agent for pitrix
getty@tty1.service            loaded active running Getty on tty1
gssproxy.service              loaded active running GSSAPI Proxy Daemon
irqbalance.service            loaded active running irqbalance daemon
kubelet.service               loaded active running Kubernetes Kubelet Server
NetworkManager.service        loaded active running Network Manager
polkit.service                loaded active running Authorization Manager
postfix.service               loaded active running Postfix Mail Transport Agent
rpcbind.service               loaded active running RPC bind service
rsyslog.service               loaded active running System Logging Service
smarteye-server-agent.service loaded active running The Smarteye Monitoring of server
sshd.service                  loaded active running OpenSSH server daemon
systemd-journald.service      loaded active running Journal Service
systemd-logind.service        loaded active running Login Service
systemd-udevd.service         loaded active running udev Kernel Device Manager
tuned.service                 loaded active running Dynamic System Tuning Daemon
-------------------------------------------------
监听端口:

Proto Recv-Q Send-Q Local Address           Foreign Address         State       PID/Program name
tcp        0      0 127.0.0.1:9099          0.0.0.0:\*               LISTEN      10444/calico-node
tcp        0      0 172.16.60.2:2379        0.0.0.0:\*               LISTEN      1321/etcd
tcp        0      0 127.0.0.1:2379          0.0.0.0:\*               LISTEN      1321/etcd
tcp        0      0 172.16.60.2:9100        0.0.0.0:\*               LISTEN      2868/./kube-rbac-pr
tcp        0      0 127.0.0.1:9100          0.0.0.0:\*               LISTEN      2314/node_exporter
tcp        0      0 172.16.60.2:2380        0.0.0.0:\*               LISTEN      1321/etcd
tcp        0      0 172.16.60.2:10255       0.0.0.0:\*               LISTEN      1222/kubelet
tcp        0      0 0.0.0.0:111             0.0.0.0:\*               LISTEN      1/systemd
tcp        0      0 0.0.0.0:6800            0.0.0.0:\*               LISTEN      850/ceph-osd
tcp        0      0 0.0.0.0:6801            0.0.0.0:\*               LISTEN      850/ceph-osd
tcp        0      0 0.0.0.0:6802            0.0.0.0:\*               LISTEN      850/ceph-osd
tcp        0      0 0.0.0.0:179             0.0.0.0:\*               LISTEN      10755/bird
tcp        0      0 0.0.0.0:6803            0.0.0.0:\*               LISTEN      850/ceph-osd
tcp        0      0 169.254.25.10:53        0.0.0.0:\*               LISTEN      2058/node-cache
tcp        0      0 0.0.0.0:22              0.0.0.0:\*               LISTEN      552/sshd
tcp        0      0 127.0.0.1:25            0.0.0.0:\*               LISTEN      786/master
tcp        0      0 127.0.0.1:40416         0.0.0.0:\*               LISTEN      1222/kubelet
tcp        0      0 172.16.60.2:6789        0.0.0.0:\*               LISTEN      661/ceph-mon
tcp        0      0 169.254.25.10:9254      0.0.0.0:\*               LISTEN      2058/node-cache
tcp        0      0 127.0.0.1:10248         0.0.0.0:\*               LISTEN      1222/kubelet
tcp        0      0 127.0.0.1:10249         0.0.0.0:\*               LISTEN      2854/kube-proxy
tcp        0      0 172.16.60.2:10250       0.0.0.0:\*               LISTEN      1222/kubelet
tcp6       0      0 :::10251                :::\*                    LISTEN      12358/kube-schedule
tcp6       0      0 :::6443                 :::\*                    LISTEN      1929/kube-apiserver
tcp6       0      0 :::10252                :::\*                    LISTEN      12366/kube-controll
udp6       0      0 :::111                  :::\*                                1/systemd
udp6       0      0 ::1:323                 :::\*                                530/chronyd
udp6       0      0 :::703                  :::\*                                535/rpcbind
-------------------------------------------------
内核参考配置:

net.ipv4.ip_forward = 1
net.bridge.bridge-nf-call-ip6tables = 1
net.bridge.bridge-nf-call-iptables = 1
net.ipv4.ip_local_reserved_ports = 30000-32767
net.bridge.bridge-nf-call-arptables = 1
-------------------------------------------------
系统登录用户:

root:x:0:0:root:/root:/bin/bash
-------------------------------------------------
ssh 配置信息:

HostKey /etc/ssh/ssh_host_rsa_key
HostKey /etc/ssh/ssh_host_ecdsa_key
HostKey /etc/ssh/ssh_host_ed25519_key
SyslogFacility AUTHPRIV
AuthorizedKeysFile      .ssh/authorized_keys
PasswordAuthentication yes
ChallengeResponseAuthentication no
GSSAPIAuthentication no
GSSAPICleanupCredentials no
UsePAM yes
X11Forwarding yes
AcceptEnv LANG LC_CTYPE LC_NUMERIC LC_TIME LC_COLLATE LC_MONETARY LC_MESSAGES
AcceptEnv LC_PAPER LC_NAME LC_ADDRESS LC_TELEPHONE LC_MEASUREMENT
AcceptEnv LC_IDENTIFICATION LC_ALL LANGUAGE
AcceptEnv XMODIFIERS
Subsystem       sftp    /usr/libexec/openssh/sftp-server
PermitRootLogin yes
PermitEmptyPasswords no
UseDNS no
-------------------------------------------------
sudo 配置用户:

root    ALL=(ALL)       ALL
%wheel  ALL=(ALL)       ALL
-------------------------------------------------
定时任务配置:

root
@weekly /usr/bin/docker system prune -f
\*/30 \* \* \* \* /opt/etcd_back/etcd_backup.sh
-------------------------------------------------
hosts 信息:

127.0.0.1 localhost localhost.localdomain localhost4 localhost4.localdomain4
::1 localhost6 localhost6.localdomain6 localhost6.localdomain
172.16.60.2 master
172.16.60.3 node01
172.16.60.4 node02
172.16.60.5 node03
172.16.60.2 master.cluster.local master
172.16.60.3 node01.cluster.local node01
172.16.60.4 node02.cluster.local node02
172.16.60.5 node03.cluster.local node03
172.16.60.2  harbor.devops.kubesphere.local
172.16.60.2  gitlab.devops.kubesphere.local
-------------------------------------------------
CPU占用top10:

  PID USER      PR  NI    VIRT    RES    SHR S  %CPU %MEM     TIME+ COMMAND
 1222 root      20   0 1401200 142324  19560 S  11.8  0.9   6197:32 kubelet
 7119 root      20   0  144632  16016   4840 S   5.9  0.1 263:45.19 coredns
 9761 1001      20   0  133952  19360   3444 S   5.9  0.1 589:46.42 jaeger-operator
12366 root      20   0  821212 130924  21304 S   5.9  0.8  20:30.77 kube-controller
15129 root      20   0  169104  39880   6176 S   5.9  0.2 212:52.15 mixs
15251 root      20   0  157848   2148   1408 R   5.9  0.0   0:00.02 top
19934 root      20   0 10.074g  26564   4612 S   5.9  0.2 342:47.40 etcd
    1 root      20   0  194876   6912   2996 S   0.0  0.0   7:21.74 systemd
    2 root      20   0       0      0      0 S   0.0  0.0   0:09.02 kthreadd
    3 root      20   0       0      0      0 S   0.0  0.0  20:13.67 ksoftirqd/0

内存占用top10:

  PID USER      PR  NI    VIRT    RES    SHR S  %CPU %MEM     TIME+ COMMAND
 1929 root      20   0 1667544 832556  23912 S  11.8  5.1   5571:22 kube-apiserver
12967 root      20   0  9.914g 6.834g   1580 S   5.9 43.6   3672:00 java
28651 polkitd   20   0 4161568 217472   2180 S   5.9  1.3 185:46.09 java
 1321 root      20   0 10.188g 170880  18380 S  11.8  1.0   2154:47 etcd
12366 root      20   0  821212 130924  21304 S   5.9  0.8  20:30.78 kube-controller
  661 ceph      20   0  463516  67048   4476 S   5.9  0.4 280:35.51 ceph-mon
17654 root      20   0  167812  11044   2808 S   5.9  0.1   9:13.12 envoy
    1 root      20   0  194876   6912   2996 S   0.0  0.0   7:21.74 systemd
15255 root      20   0  157848   2152   1408 R  11.8  0.0   0:00.03 top
14093 polkitd   20   0  288608   6848   4208 S   5.9  0.0   0:00.02 postgres
3 ELK 安装
3.1 需求
对于软件安装,通常人工操作不仅繁琐耗时,且容易出错,可以用编写 Shell 来完成,后期如果有重复需求,可以一劳永逸,安装不易出错且提升效率,ELK 为开源日志系统 由 Elasticsearch、Logstash 和 Kibana 三部分组件组成。
3.2 思路
可以针对需要按照的各种服务单独编写脚本来进行按照,其中利用了系统内的很多命令,也包含文件的操作等,在此刚好回顾我们之前学习的内容。
3.3 实现
#!/bin/bash
#mail:xuel@anchnet.com
#data:2020/4/10
#AutoInstall ELK scripts
#Software:elasticsearch-5.4.1/logstash-5.4.1/filebeat-5.4.1/kibana-5.4.1
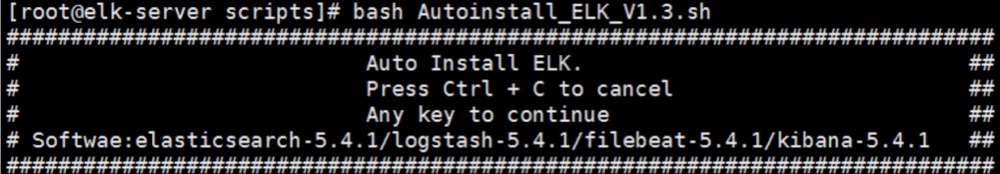
clear
echo "##########################################"
echo "# Auto Install ELK. ##"
echo "# Press Ctrl + C to cancel ##"
echo "# Any key to continue ##"
echo "##########################################"
# 读入用户选择
read -p
# 定义环境及目录变量
software_dir="/usr/local/software"
elasticsearch_url="https://artifacts.elastic.co/downloads/elasticsearch/elasticsearch-5.4.1.tar.gz"
kibana_url="https://artifacts.elastic.co/downloads/kibana/kibana-5.4.1-linux-x86\_64.tar.gz"
logstash_url="https://artifacts.elastic.co/downloads/logstash/logstash-5.4.1.tar.gz"
filebeat_url="https://artifacts.elastic.co/downloads/beats/filebeat/filebeat-5.4.1-linux-x86\_64.tar.gz"
sys_version=`cat /etc/redhat-release |awk '{print $4}'|cut -d. -f1`
IP=`ip addr|grep "inet "|grep -v 127.0.0.1|awk '{print $2}'|cut -d/ -f1`
jvm_conf="/usr/local/elasticsearch/config/jvm.options"
sys_mem=`free -m|grep Mem:|awk '{print $2}'|awk '{sum+=$1} END {print sum/1024}'|cut -d. -f1`
#下载软件函数,
wget_fun() {
if [ ! -d ${software\_dir} ];then
mkdir -p ${software\_dir} && cd ${software\_dir}
else
cd ${software\_dir}
fi
for software in $elasticsearch\_url $kibana\_url $logstash\_url $filebeat\_url
do
wget -c $software
done
clear
}
# 初始化系统,安装java环境,设置主机名称,禁用防火墙
init_sys() {
[ -f /etc/init.d/functions ] && . /etc/init.d/functions
[ "${sys\_version}" != "7" ] && echo "Error:This Scripts Support Centos7.xx" && exit 1
[ $(id -u) != "0" ] && echo "Error: You must be root to run this script" && exit 1
sed -i "s/SELINUX=enforcing/SELINUX=disabled/" /etc/selinux/config
setenforce 0
yum install -y java-1.8.0-openjdk wget net-tools
hostnamectl set-hostname elk-server
systemctl stop firewalld
# 修改文件/进程打开数
cat >>/etc/security/limits.conf<<EOF
\* soft nofile 65536
\* hard nofile 65536
\* soft nproc 65536
\* hard nproc 65536
EOF
}
# 安装elasticsearch
install_elasticsearch() {
cd $software\_dir
tar zxf elasticsearch-5.4.1.tar.gz
mv elasticsearch-5.4.1 /usr/local/elasticsearch
mkdir -p /usr/local/elasticsearch/data /usr/local/elasticsearch/logs
# 增加用户
useradd elasticsearch
chown -R elasticsearch:elasticsearch /usr/local/elasticsearch
echo "vm.max\_map\_count = 655360" >>/etc/sysctl.conf && sysctl -p
# 修改配置文件
if [ ${sys\_mem} -eq 0 ];then
sed -i "s#`grep "^-Xmx" ${jvm\_conf}`#"-Xmx512m"#g" ${jvm\_conf}
sed -i "s#`grep "^-Xms" ${jvm\_conf}`#"-Xms512m"#g" ${jvm\_conf}
else
sed -i "s#`grep "^-Xmx" ${jvm\_conf}`#"-Xmx${sys\_mem}g"#g" ${jvm\_conf}
sed -i "s#`grep "^-Xms" ${jvm\_conf}`#"-Xms${sys\_mem}g"#g" ${jvm\_conf}
fi
cat >>/usr/local/elasticsearch/config/elasticsearch.yml<<EOF
cluster.name: my-application
node.name: elk-server
path.data: /usr/local/elasticsearch/data
path.logs: /usr/local/elasticsearch/logs
network.host: 127.0.0.1
http.port: 9200
discovery.zen.ping.unicast.hosts: ["elk-server"]
EOF
# 启动es服务
su - elasticsearch -c "nohup /usr/local/elasticsearch/bin/elasticsearch &"
}
#安装 logstash
install_logstash() {
cd $software\_dir
tar -zxf logstash-5.4.1.tar.gz
mv logstash-5.4.1 /usr/local/logstash
# 增加配置文件
cat>/usr/local/logstash/config/01-syslog.conf<<EOF
input {
beats {
port => "5044"
}
}
output {
elasticsearch {
hosts => "127.0.0.1:9200"
}
stdout { codec => rubydebug }
}
EOF
nohup /usr/local/logstash/bin/logstash -f /usr/local/logstash/config/01-syslog.conf & >/dev/null
}
#安装 filebeat
install_filebeat() {
cd $software\_dir
tar -zxf filebeat-5.4.1-linux-x86_64.tar.gz
mv filebeat-5.4.1-linux-x86_64 /usr/local/filebeat
cat >/usr/local/filebeat/filebeat.yml<<EOF
filebeat.prospectors:
- input\_type: log
paths:
- /var/log/\*.log
output.logstash:
hosts: ["127.0.0.1:5044"]
EOF
cd /usr/local/filebeat/
nohup /usr/local/filebeat/filebeat & >/dev/null
}
#安装 kibana
install_kibana() {
cd $software\_dir
tar -zxf kibana-5.4.1-linux-x86_64.tar.gz
mv kibana-5.4.1-linux-x86_64 /usr/local/kibana
# 增加配置文件
cat >> /usr/local/kibana/config/kibana.yml <<EOF
server.port: 5601
server.host: "0.0.0.0"
elasticsearch.url: "http://127.0.0.1:9200"
EOF
nohup /usr/local/kibana/bin/kibana & >/dev/null
}
# 检测服务
check() {
port=$1
program=$2
check_port=`netstat -lntup|grep ${port}|wc -l`
check_program=`ps -ef|grep ${program}|grep -v grep|wc -l`
if [ $check\_port -gt 0 ] && [ $check\_program -gt 0 ];then
action "${program} run is ok!" /bin/true
else
action "${program} run is error!" /bin/false
fi
}
# 主函数统一调用
main() {
init_sys
wget_fun
install_elasticsearch
install_filebeat
install_logstash
install_kibana
echo -e "\033[32m Checking Elasticsearch...\033[0m"
sleep 20
check :9200 "elasticsearch"
echo -e "\033[32m Checking Logstash...\033[0m"
sleep 2
check ":9600" "logstash"
echo -e "\033[32m Checking Kibana...\033[0m"
sleep 2
check ":5601" "kibana"
action "ELK install is success!" /bin/true
echo "url:http://$IP:5601"
}
# 执行主函数
main
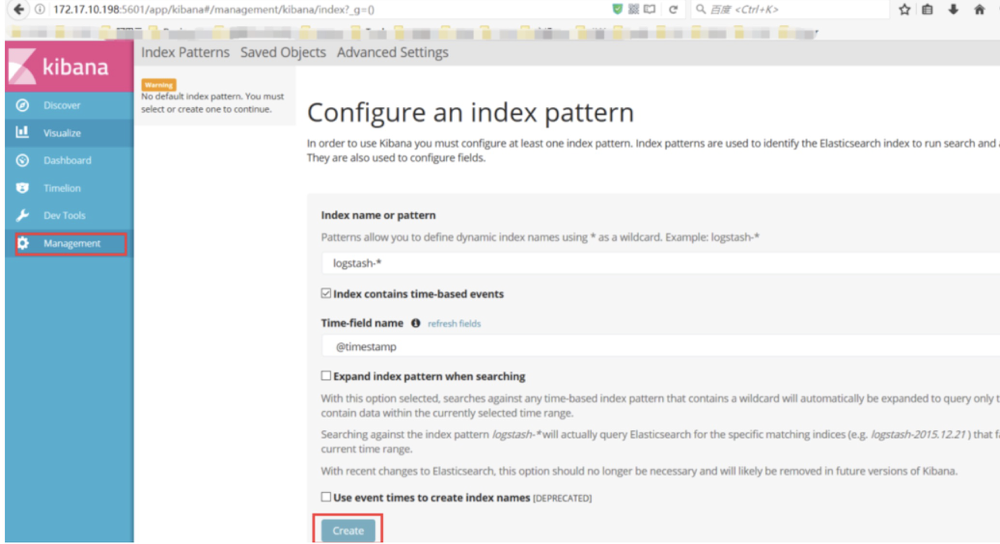
3.4 测试
 安装完成访问 http://IP:5601 即可,注意 IP 地址为按照 ELK 的服务器 IP 地址。
4. 小结
本章节我们简单的列举了两个具体实例,来实战 Shell 脚本编写处理具体问题,至此就结束了 Shell 的全部章节,在此希望本文可以带给大家 Shell 学习的一些思路和方法。
学习 Shell 需要多动手实践,在日常编写中举一反三,针对一个脚本如何能无状态,更健壮,更灵活易维护,需要多次的修改,反复的执行验证,针对不同的应用场景,将数据抽象为参数进行传递,可以达到是事半功倍的效果。注意将有限的精力放在热点知识上,其他工具或命令的常用选项或参数牢记即可,其他不常用选项不建议死记硬背,活用 —help 或 man 手册查看,这样在后期的 Shell 编写中能够更加的快速高效。